Description
Empower yourself on your health journey with the AceDigi Blood Sugar Chart—an innovative tool designed to help you monitor your blood sugar levels effectively. This free resource not only allows you to track your blood sugar throughout the day but also enables you to input normal, high, and low levels, providing a comprehensive overview of your adherence to a healthy range. With features allowing notes on medication, diet, exercise, and the inclusion of A1C levels, this chart stands as a holistic companion in managing your well-being.
Description of the AceDigi Blood Sugar Chart:
Crafted based on feedback from users and medical professionals, the AceDigi Blood Sugar Chart introduces graphical and color-coded data points to enhance the interpretation of measurements. This feature is particularly valuable as it aligns with different target levels based on the time of day and activity. Users can create multiple copies of the worksheet, each covering a 2-week period, facilitating seamless tracking and documentation. It is encouraged to bring a printed copy of the chart to doctor appointments for informed discussions about your health.
Using the AceDigi Blood Sugar Chart:
- Tracking Blood Sugar Levels:
Employing the Blood Sugar Chart empowers individuals to gain control over their health by systematically monitoring blood sugar levels. Regular tracking, along with dietary and exercise insights, offers valuable data for maintaining optimal levels and overall health. The chart accommodates entries for various times of the day and specific activities.
Pro Tip: Regularly measuring blood sugar levels using a blood glucose meter provides real-time insights. Consult your healthcare provider for personalized guidance on the frequency of measurements.
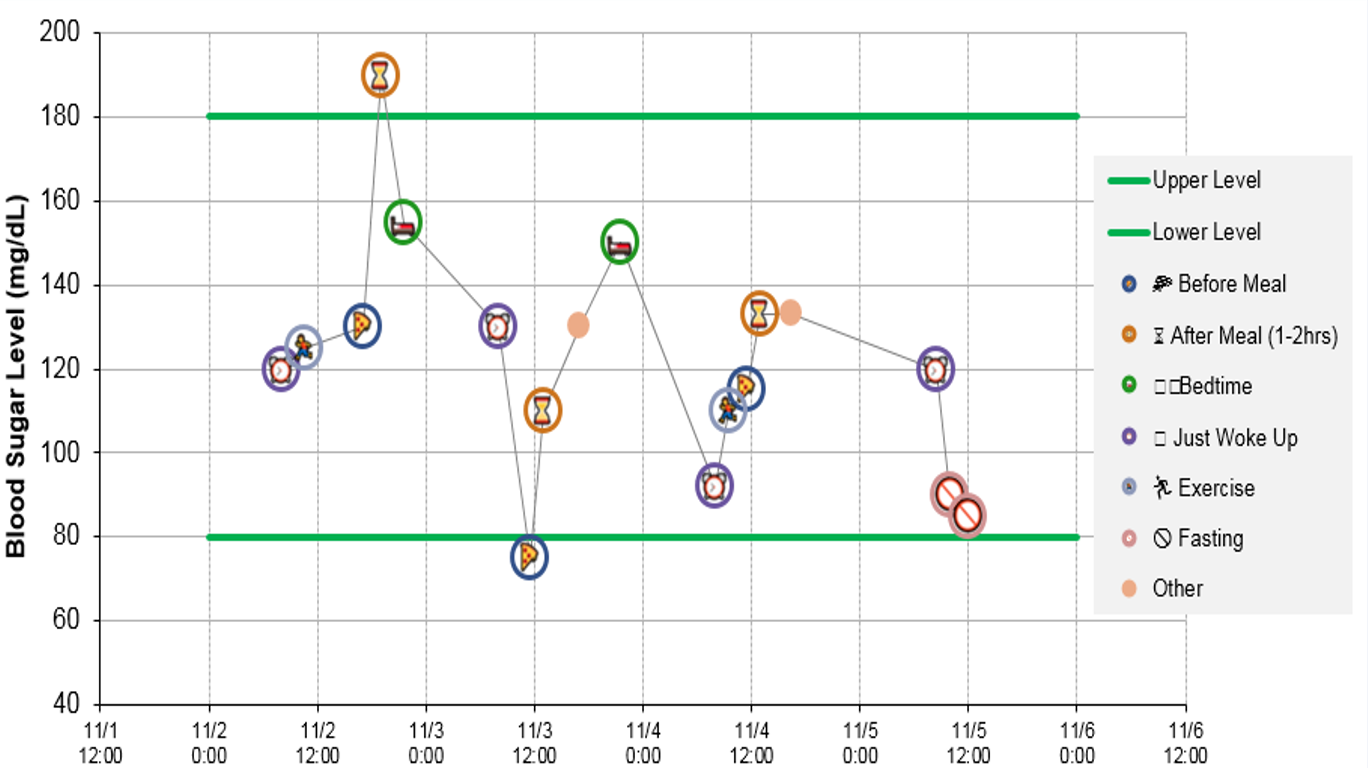
- Graphical and Color-Coded Data Points:
The introduction of graphical and color-coded data points in the AceDigi Blood Sugar Chart sets it apart. This feature allows users to visualize the activity associated with each blood sugar measurement. Different target levels are applied based on factors such as the time of day and ongoing activities, providing a nuanced understanding of the data.
Enhanced Interpretation: Graphical representations enhance the interpretability of blood sugar measurements, making it easier for individuals to comprehend the impact of varying levels on their health.
- Creating Multiple Charts:
Users are encouraged to create multiple copies of the worksheet, each covering a 2-week period. This strategic approach aids in maintaining organized records and facilitates a clear overview of blood sugar trends over time. Having distinct charts for different periods supports a comprehensive analysis of health patterns.
Organizational Advantage: Managing your health effectively involves organizing data systematically. Creating separate charts for distinct time periods assists in identifying trends, triggers, and areas for improvement.
- Integration of Notes:
The AceDigi Blood Sugar Chart allows users to input notes alongside each entry. These notes can encompass details about medication, dietary choices, exercise routines, or any other factors influencing blood sugar levels. This integrated feature supports a holistic understanding of the variables impacting health.
Comprehensive Insight: Recording contextual information alongside blood sugar measurements provides a more comprehensive picture. Understanding the influence of lifestyle factors enables informed decision-making.
- A1C Level Tracking:
Acknowledging the significance of A1C levels, the AceDigi Blood Sugar Chart facilitates seamless tracking of A1C (hemoglobin HbA1c) levels. Regular A1C tests, typically conducted by healthcare providers, offer insights into long-term blood sugar control.
Collaborative Healthcare: Sharing A1C level trends with healthcare providers contributes to collaborative care planning. It allows healthcare professionals to tailor care plans based on your unique health profile.
Empowering Your Health with AceDigi:
The AceDigi Blood Sugar Chart emerges as a pivotal tool in the journey towards optimal health. By combining user-friendly features, graphical representations, and comprehensive tracking capabilities, AceDigi strives to empower individuals to take charge of their well-being. Whether you’re embarking on a new health plan or managing an existing one, AceDigi is your trusted companion for informed and proactive health decisions. Download the AceDigi Blood Sugar Chart today and embark on a journey towards a healthier, more empowered you.

Reviews
There are no reviews yet.