Description
Introduction:
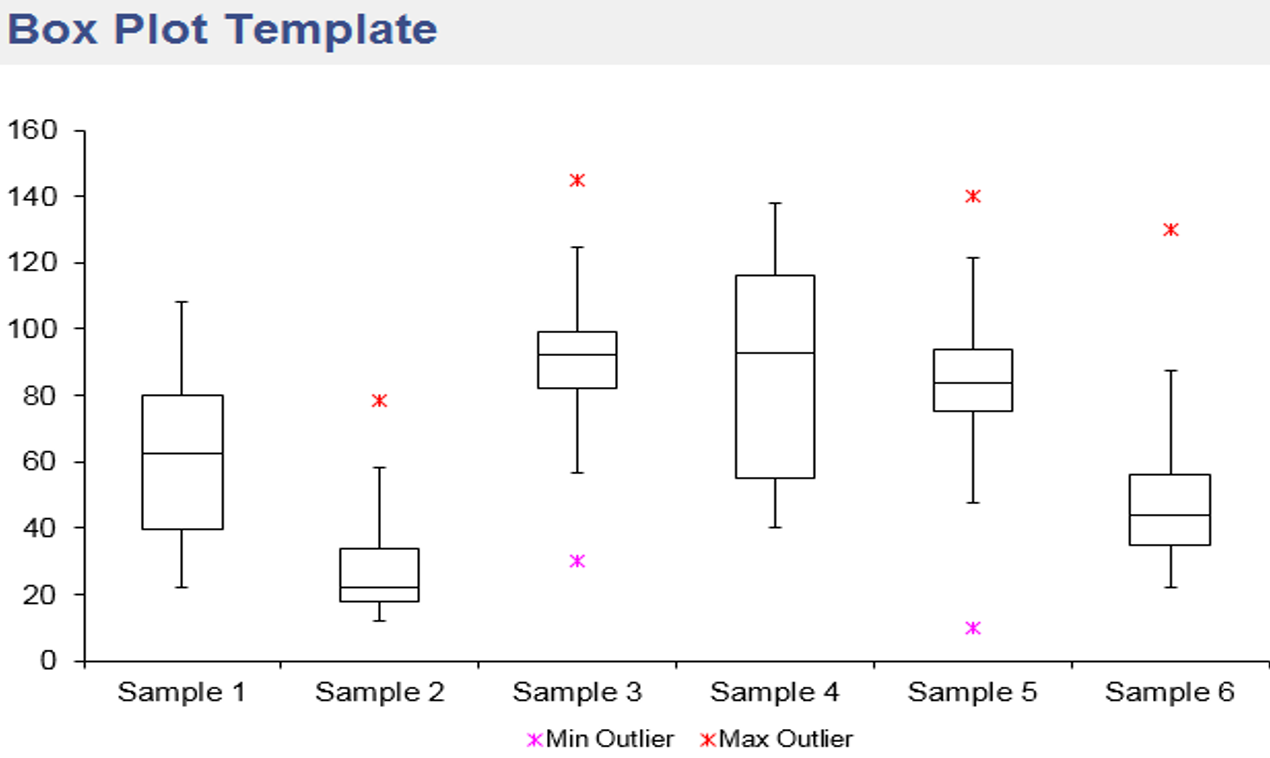
AceDigi introduces an innovative Box and Whisker Plot Template, a powerful tool designed to create comprehensive visualizations in Excel for Excel 2016 or later versions. This template streamlines the process of generating box plots by utilizing the built-in Box and Whisker chart feature, offering a user-friendly interface for effective data representation. In this guide, we will explore the functionalities of the template, the techniques used for creating box plots, and important considerations for optimal utilization.
Key Features:
- Built-in Box and Whisker Chart:
The AceDigi Box and Whisker Plot Template harnesses the capabilities of Excel 2016 or later, leveraging the new built-in Box and Whisker chart feature. This built-in functionality eliminates the need for complex workarounds, providing users with a seamless and efficient solution for visualizing data.
- Easy Data Entry and Automatic Updates:
Users can effortlessly create box plots by entering their data into the designated Data sheet. The corresponding chart in the Plot worksheet updates automatically, ensuring a real-time representation of the dataset. This simplicity accelerates the process of data visualization and analysis.
- Limitation Awareness:
The template transparently communicates limitations to users. Specifically, it notes that the template displays only the maximum or minimum outliers if present. However, it emphasizes that the conventional approach for box plots is to show all outliers. To address this, users are encouraged to explore the new Box and Whisker Chart in Excel 2016 or later, which inherently displays all outliers.
- Handling Negative Values:
Acknowledging potential challenges with negative values, the template provides alternative solutions in additional worksheets within the file. Users can either shift the data to make it positive before creating the box plot or opt for an alternate method that avoids using bar charts, displaying Q1, Q3, and the Median using series markers instead.
- User-Friendly Data Structure:
Box plots are most effective when the underlying data is structured appropriately. The template offers an example of how to structure data for optimal box plot visualization. By understanding and replicating this structure, users can seamlessly create insightful box plots tailored to their datasets.
Creating a Box and Whisker Plot:
Box plots serve as valuable data visualization tools, particularly for comparing summary statistics across multiple datasets. Creating these plots in Excel is simplified when the data is structured correctly. The AceDigi Box and Whisker Plot Template exemplify an easy-to-follow structure, allowing users to effortlessly generate box plots for enhanced data interpretation.
Considerations and Alternatives:
- Handling Negative Values:
The template acknowledges potential challenges associated with negative values and offers practical alternatives. Users can either shift the data to ensure positivity before creating the box plot or explore alternative methods that do not rely on bar charts.
- Limitation Awareness:
While the template provides an effective solution for many scenarios, it openly communicates limitations, emphasizing the conventional display of all outliers. Users are directed towards the new Box and Whisker Chart in Excel 2016 or later for a more inclusive representation of outliers.
Conclusion:
AceDigi’s Box and Whisker Plot Template stands as a testament to its commitment to providing efficient and user-friendly tools for data visualization in Excel. The integration of the new built-in Box and Whisker chart feature simplifies the process, making it accessible to users with varying levels of Excel proficiency. The template’s awareness of limitations and provision of alternative solutions further enhance its versatility. As organizations and individuals seek to derive meaningful insights from their data, the AceDigi Box and Whisker Plot Template emerges as an invaluable resource for visualizing datasets with clarity and precision. Embrace the potential of this template to unlock a new dimension of data visualization in your Excel workflows.
Certainly! Here are five Muslim names: –
Absolutely loving these templates! They’ve brought a level of organization to my work that I didn’t know I needed. Clean designs and intuitive functionality make them a winner.
Certainly! Here are five Muslim names: –
Top-notch templates! Cover a wide range of needs with impressive attention to detail. Improved the professionalism of my reports and presentations. Highly satisfied!
Charlotte Anderson –
Must-have for anyone working with data. Functional and aesthetically pleasing. An integral part of my workflow, making data management a breeze.
Ava Richardson –
I appreciate the versatility of these templates. Whether it’s project planning or expense tracking, there’s a template for everything. They’ve become my go-to solution for various tasks.