Description
Although numerous Statistical Process Control (SPC) software tools are available, many engineers (and, dare I say, statisticians?) often opt to create control charts in Excel. The Control Chart Template on this page is crafted as an educational resource to aid in understanding the equations involved in establishing control limits for a fundamental Shewhart control chart, specifically X-bar, R, and S Charts. Further details and references related to creating control charts can be found below.
Description
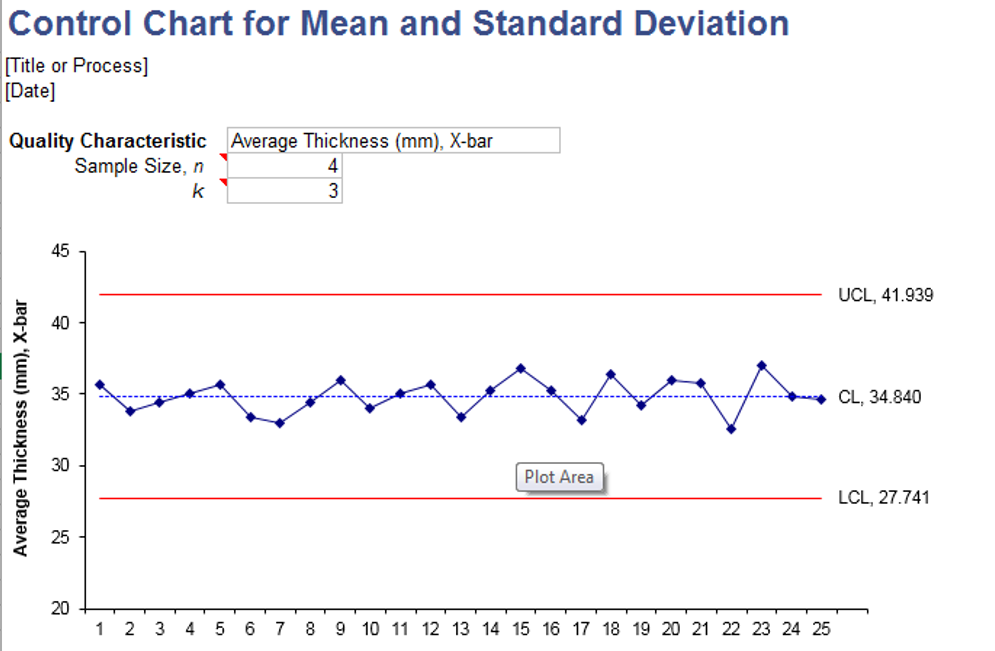
This template includes a pre-made control chart for sample Mean and Range, or sample Mean and Standard Deviation (2 worksheets in one). Simply input your data, and control limits will be calculated based on the provided information.
– Assess process capability (Cp, CPU, CPL, Cpk, and % Yield) against specified limits.
Note: In the X-bar & R control chart, the number of observations per sample (n) can range from 2 to 25. In the X-bar & S chart, n must exceed 4.
Creating a Control Chart
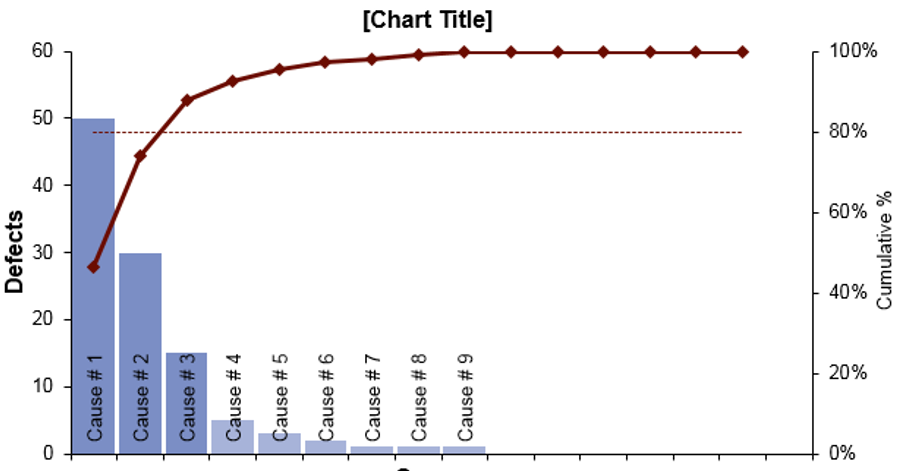
The Control Chart Template mentioned above is suitable for the most common types of control charts: the X-Bar chart (depicting the mean of a sample over time), the R chart (displaying the range or Max-Min of a sample over time), and the s chart (illustrating the sample standard deviation over time).
I developed these control charts based on the terminology used in reference [1] below. Reference [2] serves as an excellent online resource elucidating the formulas and steps for constructing these control charts.
Anticipating inquiries about the calculation of values for d2 and d3 in the X-bar and R charts, these factors represent the mean and standard deviation of the statistic W = R/σ, respectively. They can be found tabulated in most textbooks or references pertaining to control charts. W is commonly known as the relative range or studentized range, employed to estimate the process standard deviation when only the sample mean and range are known. While attempting to decipher reference [3], I opted not to engage in numerical integration of the range distribution within Excel. Instead, I hardcoded the values for these factors into an array. This limitation confines the X-bar chart to sample sizes ranging from 2 to 25. The most challenging aspect of crafting the s-chart lies in calculating the c4 factor, necessitating the use of the Gamma function for factorial calculations involving half-integer numbers.
5. Omar Hassan –
Using these templates has been a time-saver. The ease of use combined with the polished designs has elevated my work. It’s like having a design team at my fingertips!
Certainly! Here are five Muslim names: –
Using these templates feels like having a personal assistant. They’ve made my workload more manageable, and the results are consistently impressive. Highly recommended!
2. Fatima Khan –
I’ve tried various templates before, but these stand out. They’re not just functional; they add a touch of elegance to my work. Definitely worth the investment.
Sophia Williams –
I’ve tried various templates before, but these stand out. They’re not just functional; they add a touch of elegance to my work. Definitely worth the investment.