Description
AceDigi Gantt Chart: Revolutionizing Project Management
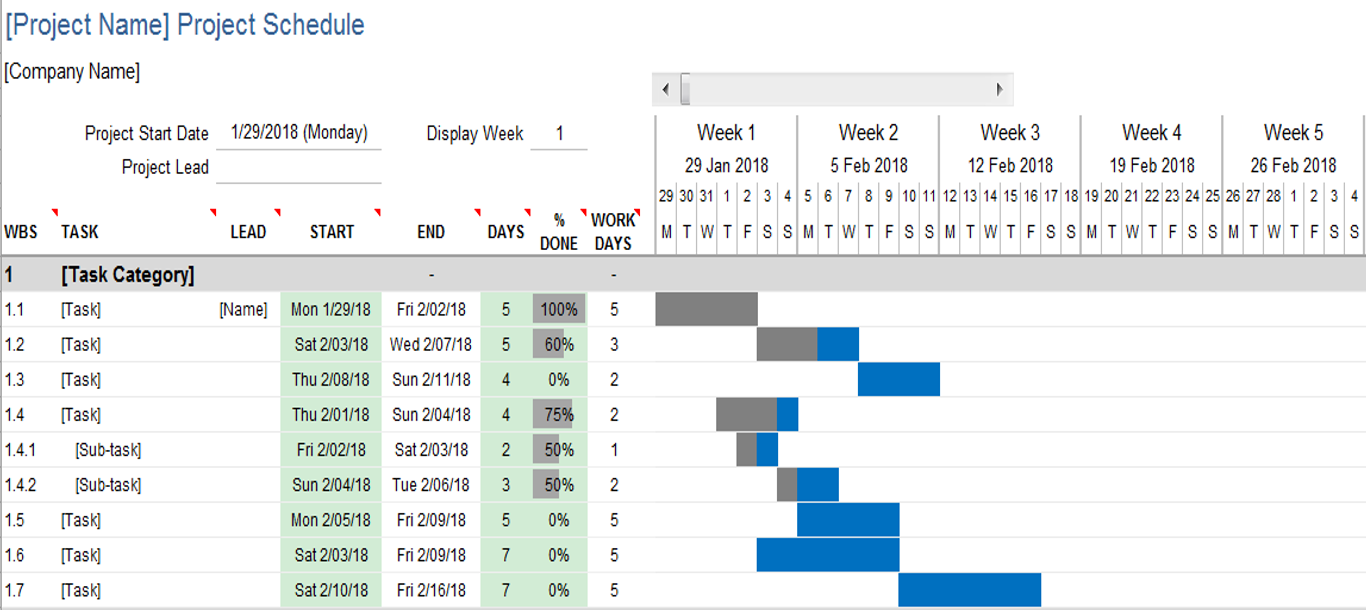
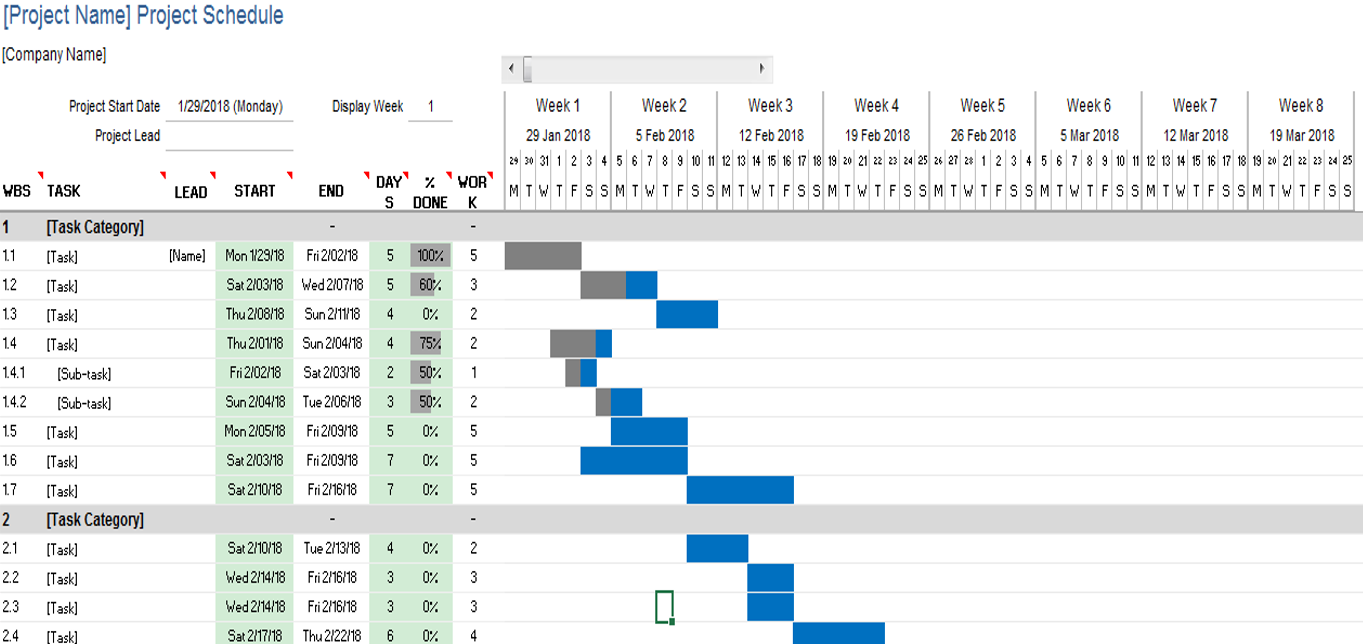
The Gantt chart, pioneered by Henry Gantt in the early 1900s, has evolved into an indispensable tool for effective project management. This type of bar chart provides a visual representation of task start and end times within a project schedule. Typically, tasks are categorized using a work breakdown structure, incorporating summary tasks for major project deliverables and sub-tasks that create a detailed and manageable task hierarchy. With the AceDigi Gantt Chart Template, tailored for use with Excel or Google Sheets, creating project schedules becomes an intuitive process, requiring minimal learning curve compared to traditional methods.
AceDigi Gantt Chart Template Overview
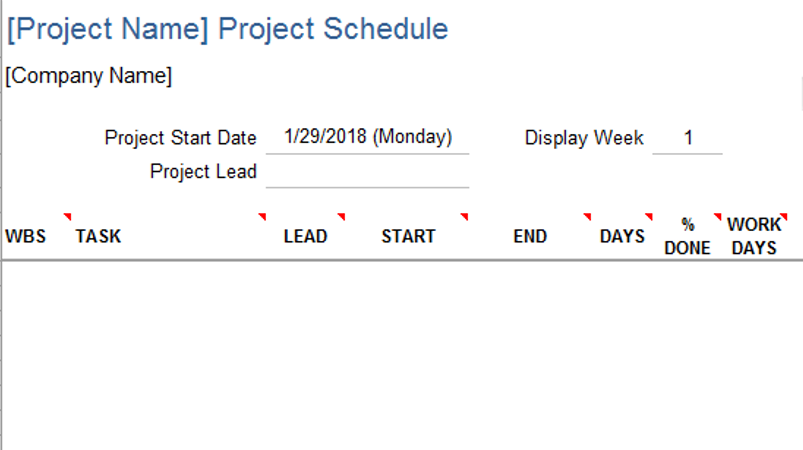
The AceDigi Gantt Chart Template encapsulates core functionality, simplifying the creation of Gantt charts. Each row within the worksheet corresponds to an individual task, requiring the definition of the start date and duration for each task.
Key Features of the Template:
- Task Addition: Easily add more tasks by copying and pasting rows or inserting a row and using Ctrl+D to copy formulas down.
- Date Range Adjustment: Change the displayed date range in the chart area by sliding the scroll bar.
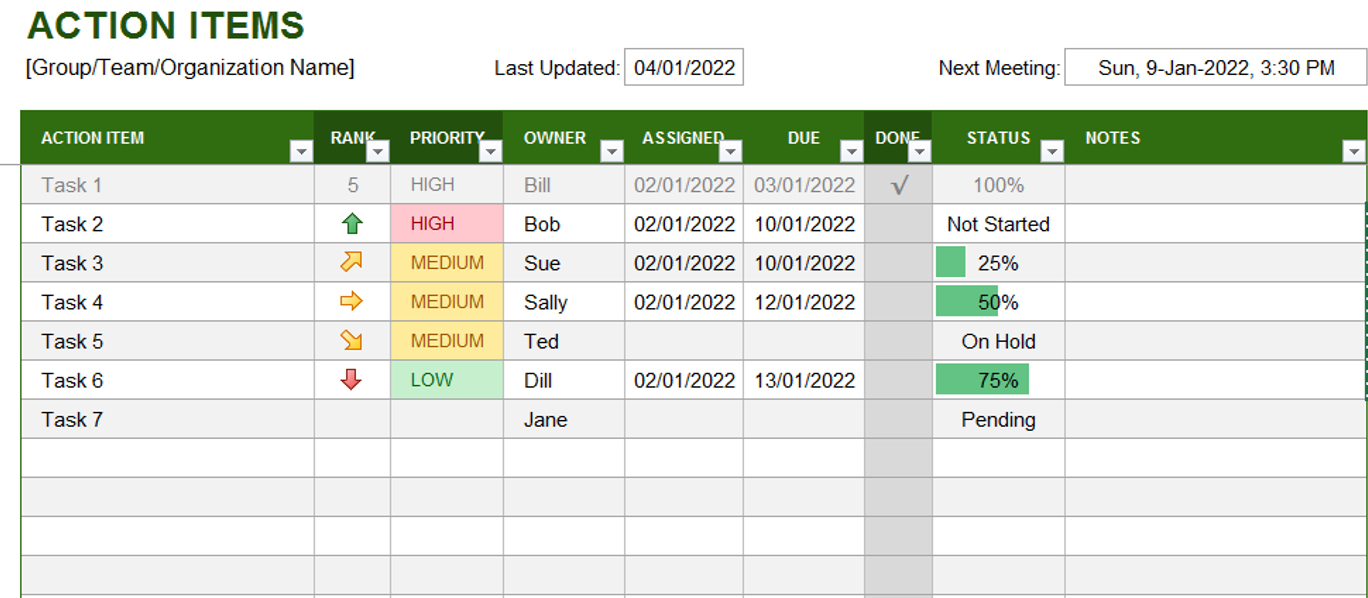
- Status Tracking: Edit the % Complete column to track the status of a task. The chart displays the % complete for each task.
- Current Date Indicator: A vertical red line indicates the current date.
- Automatic Work Breakdown Structure (WBS) Numbering:** Copy the formula from the bottom of the worksheet for the desired level.
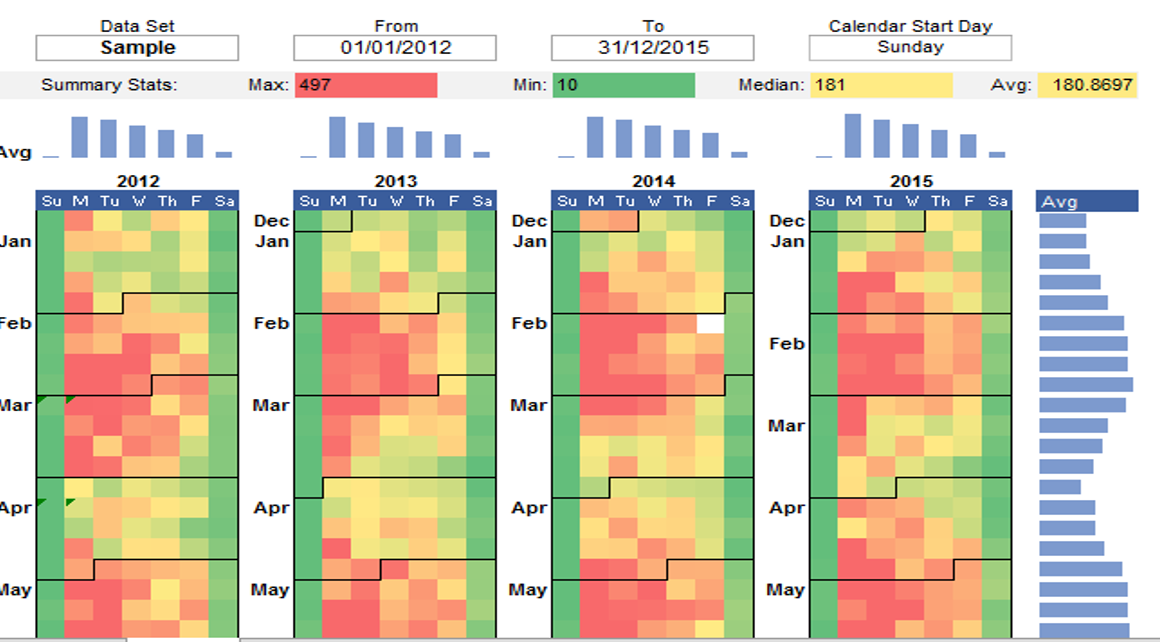
While planning a project, supplementary tools such as a yearly calendar or project budget worksheet may also prove beneficial.
Formatting Distinction:
This download offers the same functionality as the original Gantt Chart Template while introducing formatting distinctions. Notably, the WBS, End, and Work Days columns are highlighted in gray, indicating the inclusion of formulas.
Note: The Gantt Chart Pro version 5.0 adopts a design closely resembling this free version.
Creating Dependent Tasks in a Gantt Chart with Excel
Excel’s versatility in handling formulas makes it a valuable tool for creating Gantt Charts, particularly in defining task dependencies. While the Gantt Chart Template Pro streamlines this process, users can experiment with simple examples:
- Start a Task the Day After a Predecessor Task:
=end_date + 1
(where end_date is a reference to a cell, e.g., D10, containing the END date of the predecessor task).
- Start a Task on the Same Day as Another Task:
excel
=start_date
(where start_date is a reference to a cell containing the START date of the other task).
- Start a Task the Next WORK Day after a Predecessor Task (Excludes Sat & Sun):*
excel
=WORKDAY(end_date,1)
(Utilize the WORKDAY.INTL() function in Excel 2010+ to define a custom work week beyond Sat & Sun).
While formulas offer precision, one limitation is the inability to visually perceive task dependencies within the Gantt chart. While some Gantt chart software may depict dependencies as connecting lines, Excel lacks a straightforward method for achieving this.
Simplified Approach:
A simple approach involves listing the WBS number of the predecessor in another column, similar to the critical path example. In the CPM template and Gantt Chart Template Pro, formulas calculate start dates based on user input. For those venturing into independent formula creation, a starting point could be:
excel
=INDEX(range_of_end_dates, MATCH(predecessor_wbs, wbs_range, 0)
Gantt Chart Pro employs a similar formula but accommodates up to three predecessors while accounting for workdays.
Showing Critical Tasks in a Gantt Chart
Certain Gantt charts aim to highlight the critical path and available slack or float time for each task. If tasks must be executed sequentially, every task becomes critical, eliminating slack time. Conversely, tasks done in parallel with available slack time allow project managers to allocate resources strategically, prioritizing critical tasks.
In essence, the AceDigi Gantt Chart stands as a user-friendly, efficient solution for project management needs. Its simplicity, combined with the power of Excel, facilitates the creation and management of project schedules, contributing to enhanced project planning and execution.
2. Fatima Khan –
Impressed with the variety of templates available. From budgeting to project management, they cover it all. Well-designed and have significantly improved my productivity. Highly recommended!
3. Yusuf Ali –
These templates have turned mundane tasks into a breeze. The attention to detail is evident, and they’ve made data analysis surprisingly enjoyable. A fantastic find!
Amit Modi –
Must-have for anyone working with data. Functional and aesthetically pleasing. An integral part of my workflow, making data management a breeze.
1. Ahmed Malik –
Cannot express how much these templates have simplified my workload. Comprehensive and made complex tasks much more manageable. Impressed with the quality and functionality.