Description
Introduction:
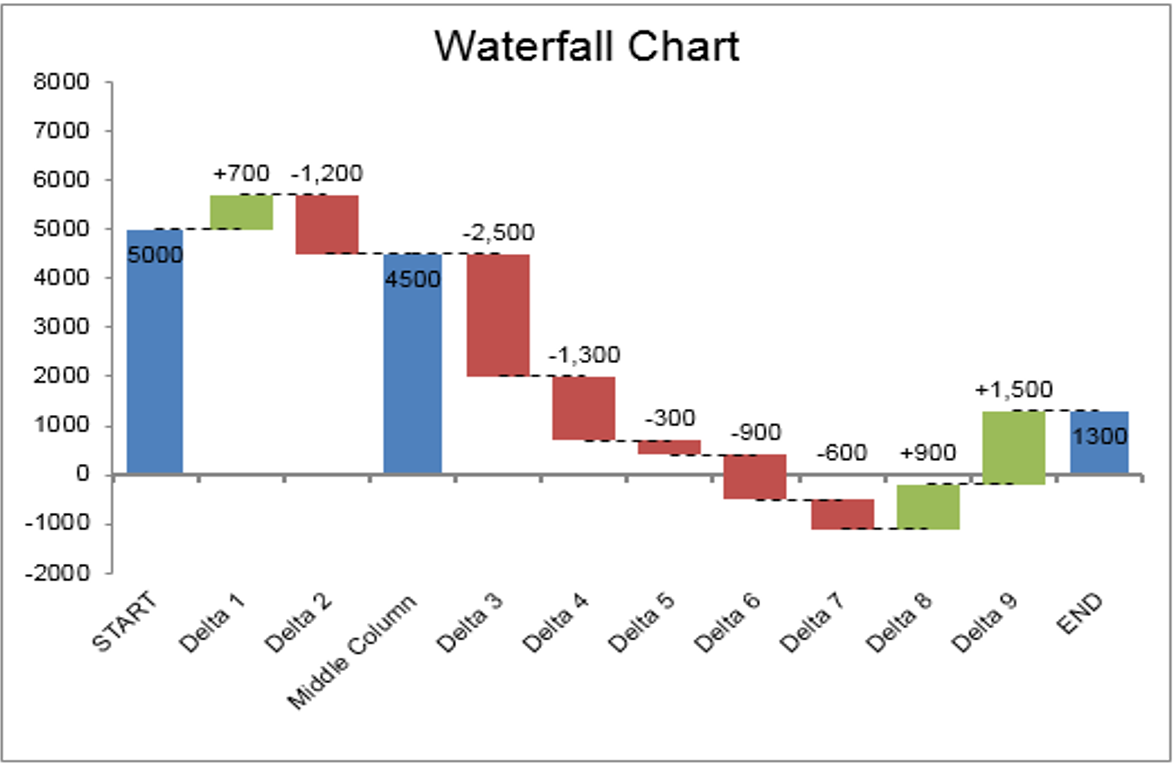
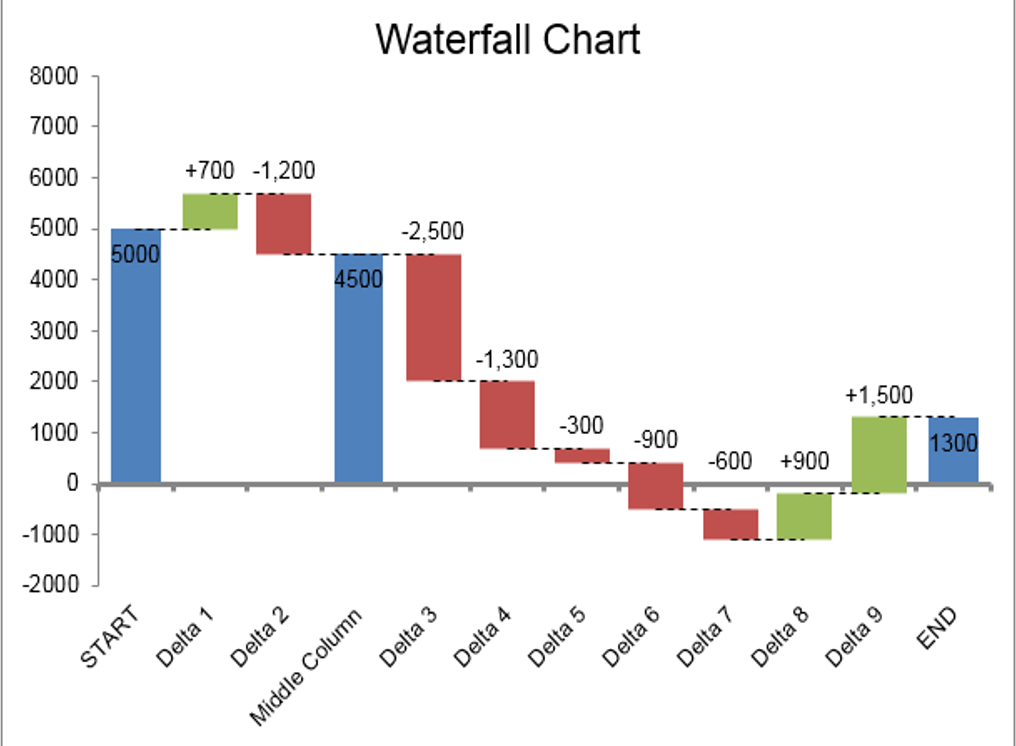
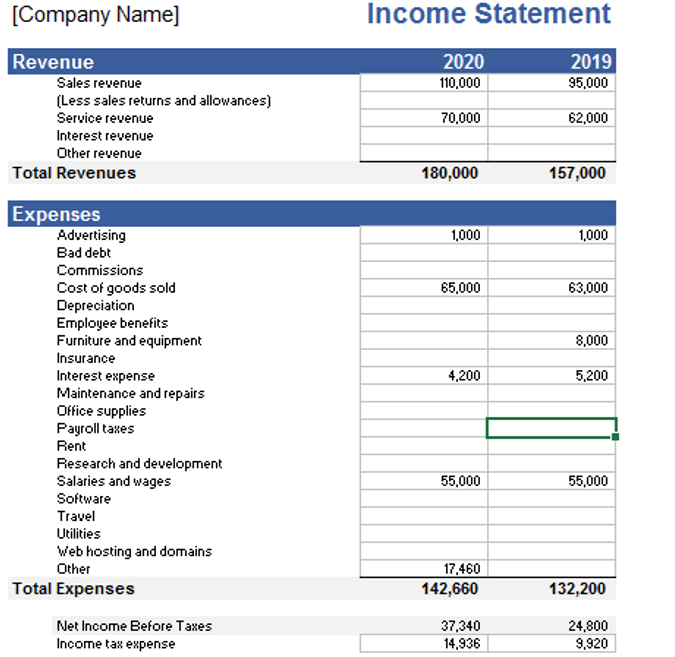
In the realm of financial analysis, the Waterfall Chart, also known as the Bridge Chart, serves as a powerful visual tool to illustrate adjustments made to an initial value. Whether breaking down expenses in an income statement or analyzing the net profit of a product, the Waterfall Chart provides a clear depiction of positive and negative adjustments leading to a final value. AceDigi introduces a unique Waterfall Chart template, offering an alternative approach using error bars for enhanced clarity and simplified handling of negative values.
Understanding the Waterfall Chart:
A Waterfall Chart is essentially a visual representation of incremental adjustments made to an initial value. This could include expenses in an income statement or various components affecting the net profit of a product. The chart resembles a bridge with two or more pillars, representing the initial and final values, and floating steps connecting them, depicting individual adjustments. AceDigi’s Waterfall Chart simplifies the visualization of financial adjustments, making it an ideal tool for presentations, reports, and financial analysis.
Template Description:
AceDigi’s Waterfall Chart template stands out by utilizing error bars for creating connecting lines and stepped values. This innovative approach offers advantages in handling negative values and simplifies the chart creation process. The template comprises two separate worksheets for horizontal and vertical waterfall charts, providing flexibility based on user preferences.
Key Features:
- Allows Negative Values:
AceDigi’s Waterfall Chart template seamlessly handles negative values, a critical feature for accurately reflecting adjustments in financial scenarios.
- Dashed Horizontal Connecting Lines:
The template includes dashed horizontal connecting lines, enhancing the visual appeal of the chart and providing a clear representation of the incremental adjustments.
- Formatted Data Labels:
Data labels are thoughtfully formatted to clearly indicate positive and negative adjustments. This ensures that stakeholders can easily interpret the chart without confusion.
- Define Intermediate Values:
Users can define intermediate values by placing an “x” in the Pillars column, allowing for customization based on specific data points that need emphasis.
- Add New Values Easily:
Inserting new rows is a straightforward process. Users can right-click on a row number, select “Insert Row,” and then copy formulas down by pressing Ctrl+D.
- No Macros:
The template does not rely on macros, ensuring user-friendly operation without complex programming.
Using the Chart in Another Workbook:
For users seeking to integrate the Waterfall Chart into an existing workbook, the template allows for seamless integration. By copying the entire waterfall worksheet into the target workbook and utilizing cell references, users can link values in the data table to values in their financial statements.
Using the Waterfall Chart Template:
AceDigi’s Waterfall Chart template offers a user-friendly experience with straightforward steps for customization:
- Easy Setup:
Edit labels, delta values, and place an “x” in the Pillars column to display intermediate values.
- Inserting/Deleting Rows:
Inserting new rows is simplified with right-click functionality. Users can copy formulas efficiently by pressing Ctrl+D. Deleting rows should be done carefully, ensuring the retention of unique formulas in the first and last rows.
- Editing Column Widths:
Column widths for pillars can be edited by adjusting the gap percentage. Positive and negative adjustments, represented by error bars, can be modified by editing line width.
- Editing Label Positions:
Data labels, displayed using invisible stacked columns, can be manually adjusted by dragging them with the mouse if their positions need fine-tuning.
- Formatting Data Labels:
To ensure precise positioning of data labels, a custom number format is applied for negative adjustments. This involves showing the negative sign “-” even when the actual values in the data table are positive.
- Selecting Error Bars and Data Labels:
The template provides an easy way to select individual chart series, error bars, and data labels through the Layout tab under the contextual Chart Tools menu.
Conclusion:
AceDigi’s Waterfall Chart template emerges as an innovative and practical tool for businesses and financial analysts seeking a visually compelling representation of financial adjustments. By adopting error bars for connecting lines and stepped values, AceDigi enhances the clarity of the chart while simplifying the handling of negative values. This template serves as a versatile solution for presentations, reports, and financial planning, empowering users to communicate financial insights with precision and ease.
1. Ahmed Malik –
Using these templates feels like having a personal assistant. They’ve made my workload more manageable, and the results are consistently impressive. Highly recommended!
Navdeep Yadav –
Must-have for anyone working with data. Functional and aesthetically pleasing. An integral part of my workflow, making data management a breeze.
Oliver Mitchell –
Must-have for anyone working with data. Functional and aesthetically pleasing. An integral part of my workflow, making data management a breeze.
Charlotte Anderson –
These templates have made collaboration with my team smoother. The shared templates ensure consistency in our reports, and the feedback from my colleagues has been overwhelmingly positive.